
Browse Items (13654 total)
Sort by:
Seedling Growth Plotted Against Nitrogen Concentration
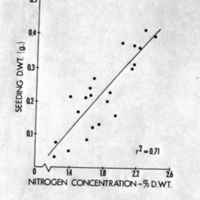
Seedling growth plotted against Nitrogen concentration to show a linear relationship.
Changes in Nutrient Concentration with Plant Size
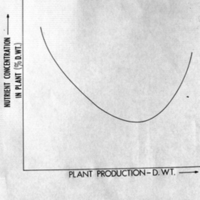
Changes in nutrient concentration with plant size to show the Steenjberg effect.
Changes in Nutrient Concentration
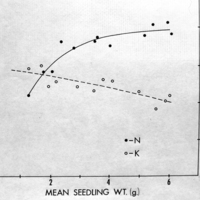
Changes in nutrient concentration (N & K) in relation to seedling size.
Relationship Between Growth and Nitrogen Supply
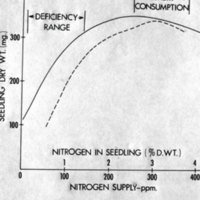
Relationship between growth and Nitrogen supply and N concentration to illustrate "deficiency" & "luxury consumption."
Slide Listing Types of Diagnostic Relationships
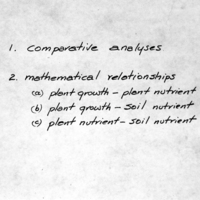
Slide listing types of diagnostic relationships used in nutritional studies.
Pot Trial of Banksia Grandis
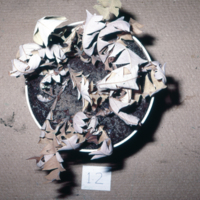
Pot trial of Banksia grandis in soil infected with Phytophthora cinn; N.B. dead seedlings.
Culture of Banksia Grandis
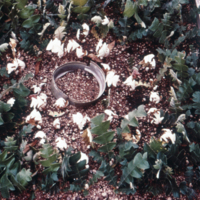
Culture of Banksia grandis with infected area of Phytophthora cinn. in the centre.
Blue Lupin Culture
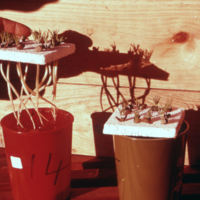
Blue lupin culture grown in Banksia trays (infected with P.cinnamomi). See Newhook article.
Plate Cultivation of Phytophthora Cinnamomi From Jarrah
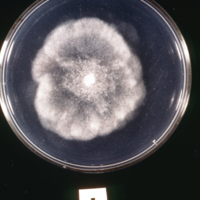
Plate cultivation of Phytophthora cinnamomi from jarrah; Photo: Zentmyer
Oospore of Phytophthora Cinnamomi
Oospore of Phytophthora cinnamomi in Banksia grandis.